
reports and infographics
I love the puzzle of turning data into a story. Finding the narrative, deciding what matters, and then using charts, infographics and visual structure to make it instantly understandable. For me, good data design is a shortcut to the story — making complex information clear, compelling and easy to explore.
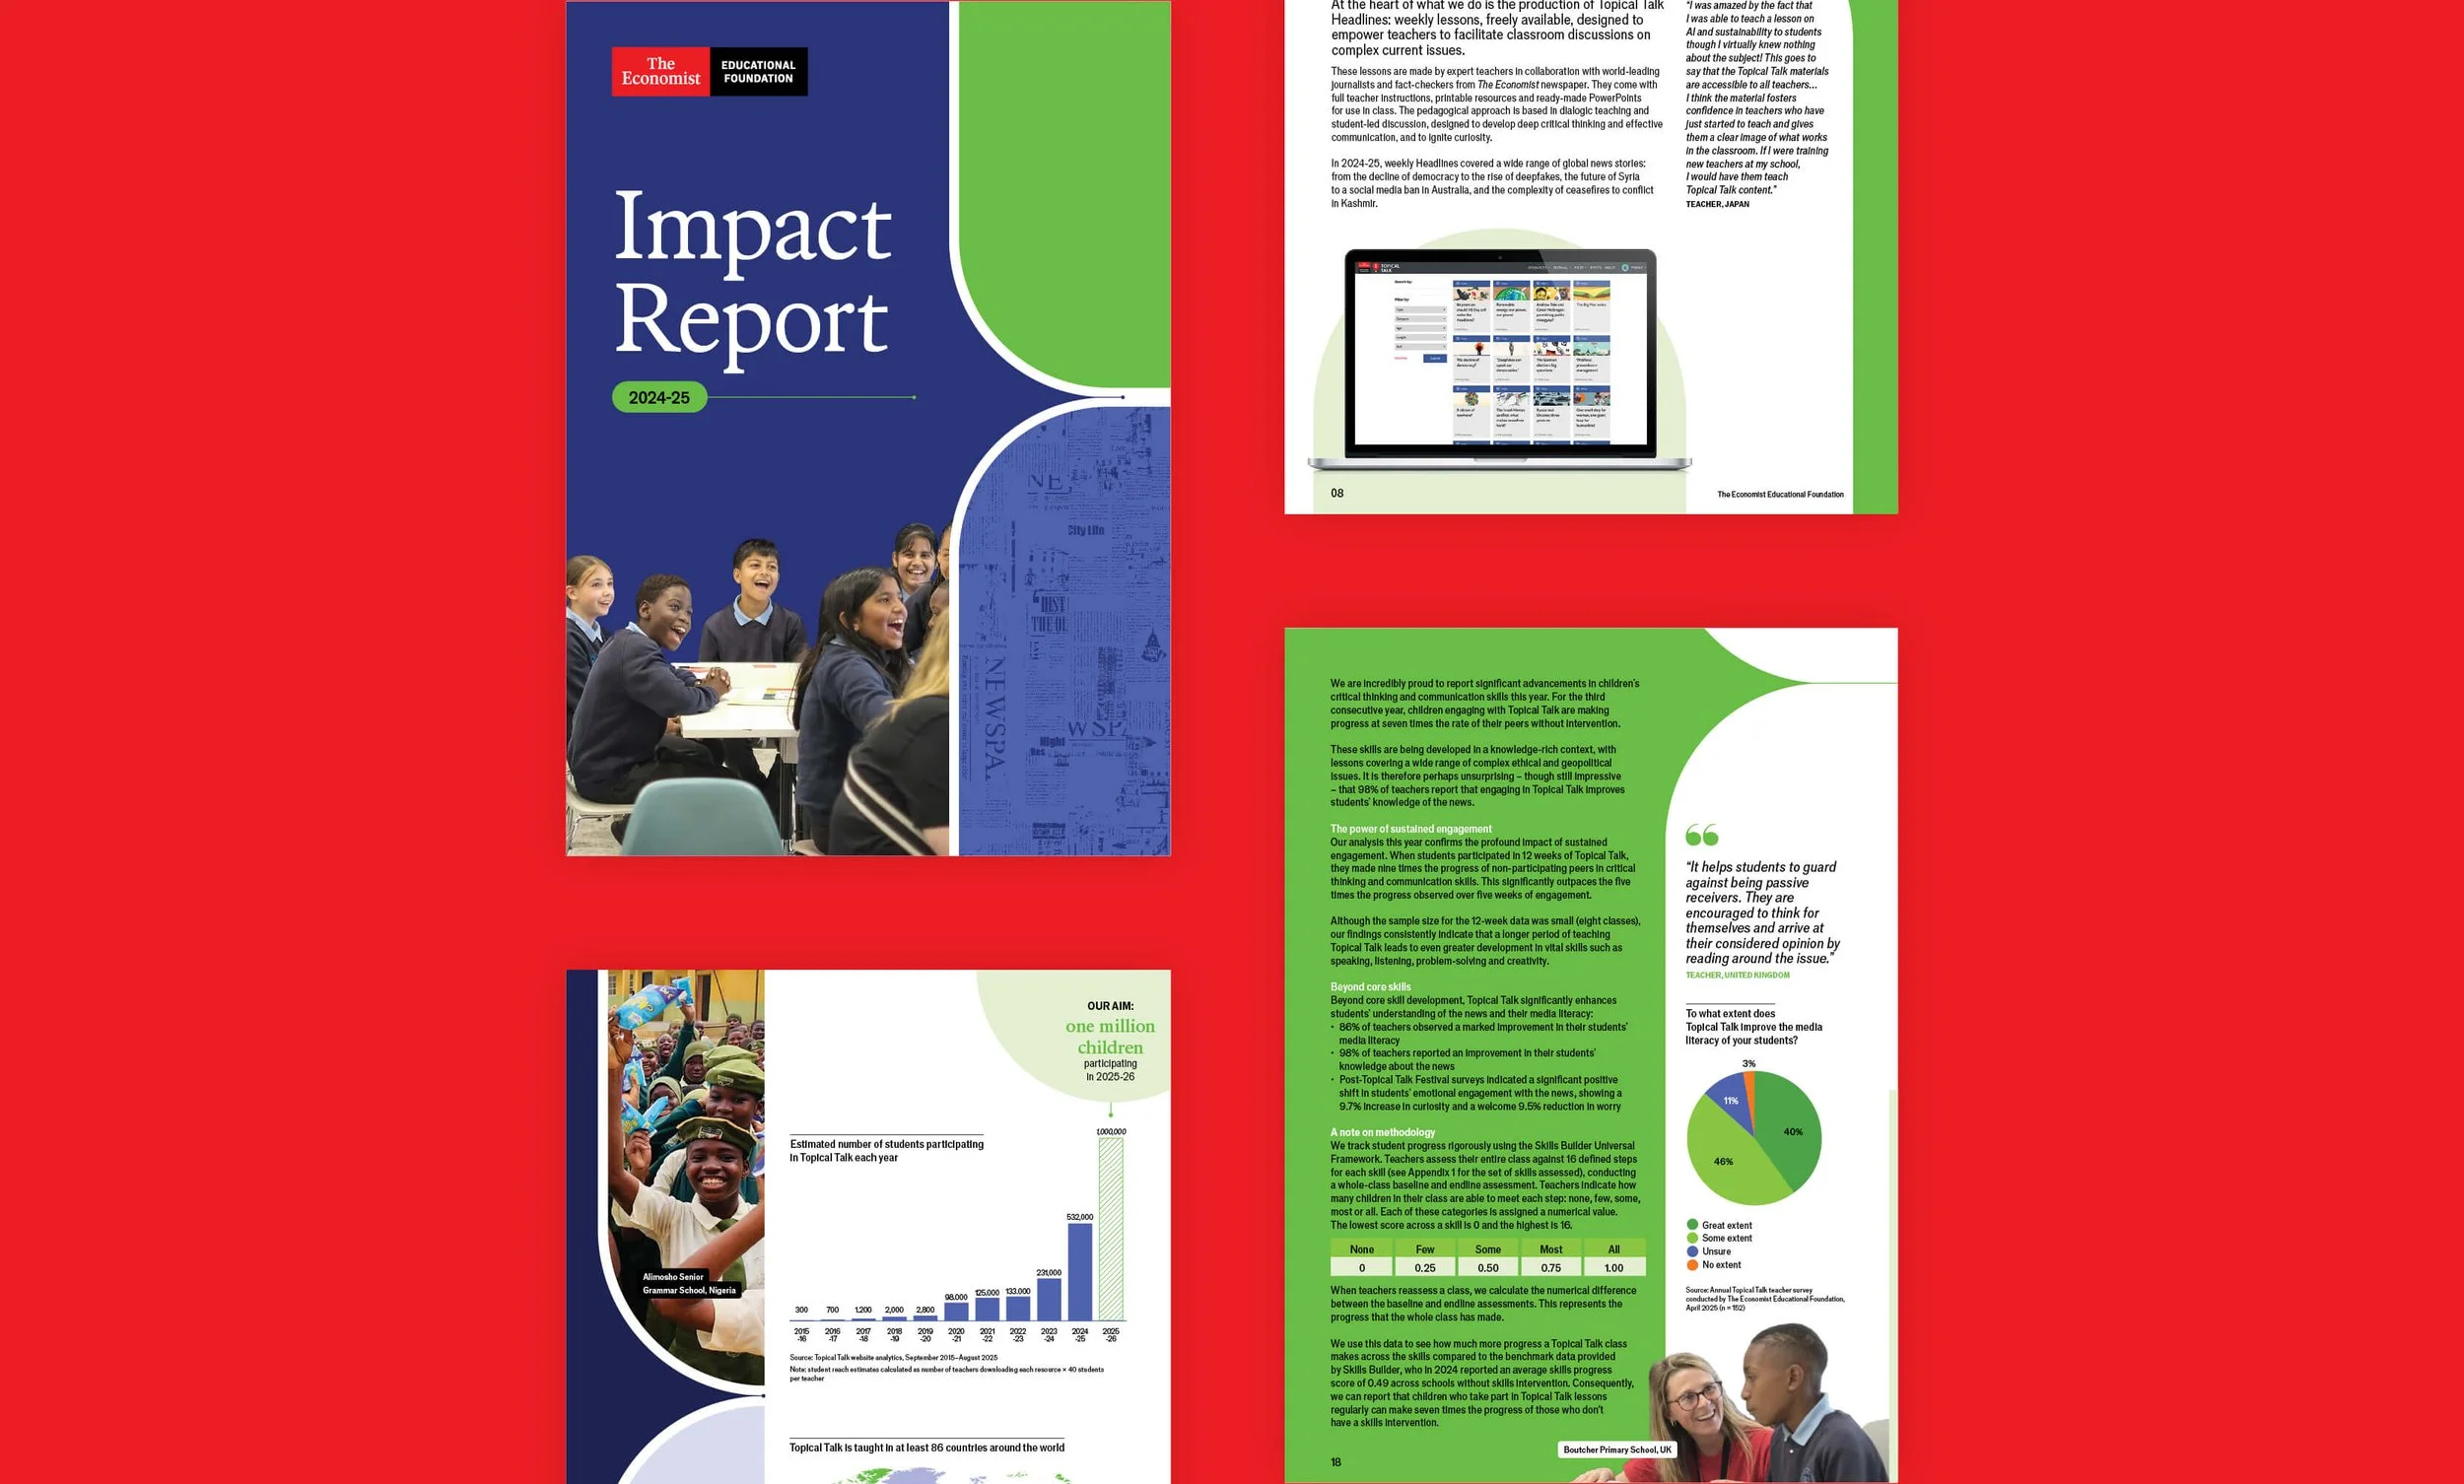
Project
Impact reports for The Economist Educational Foundation
Year
2016-2026
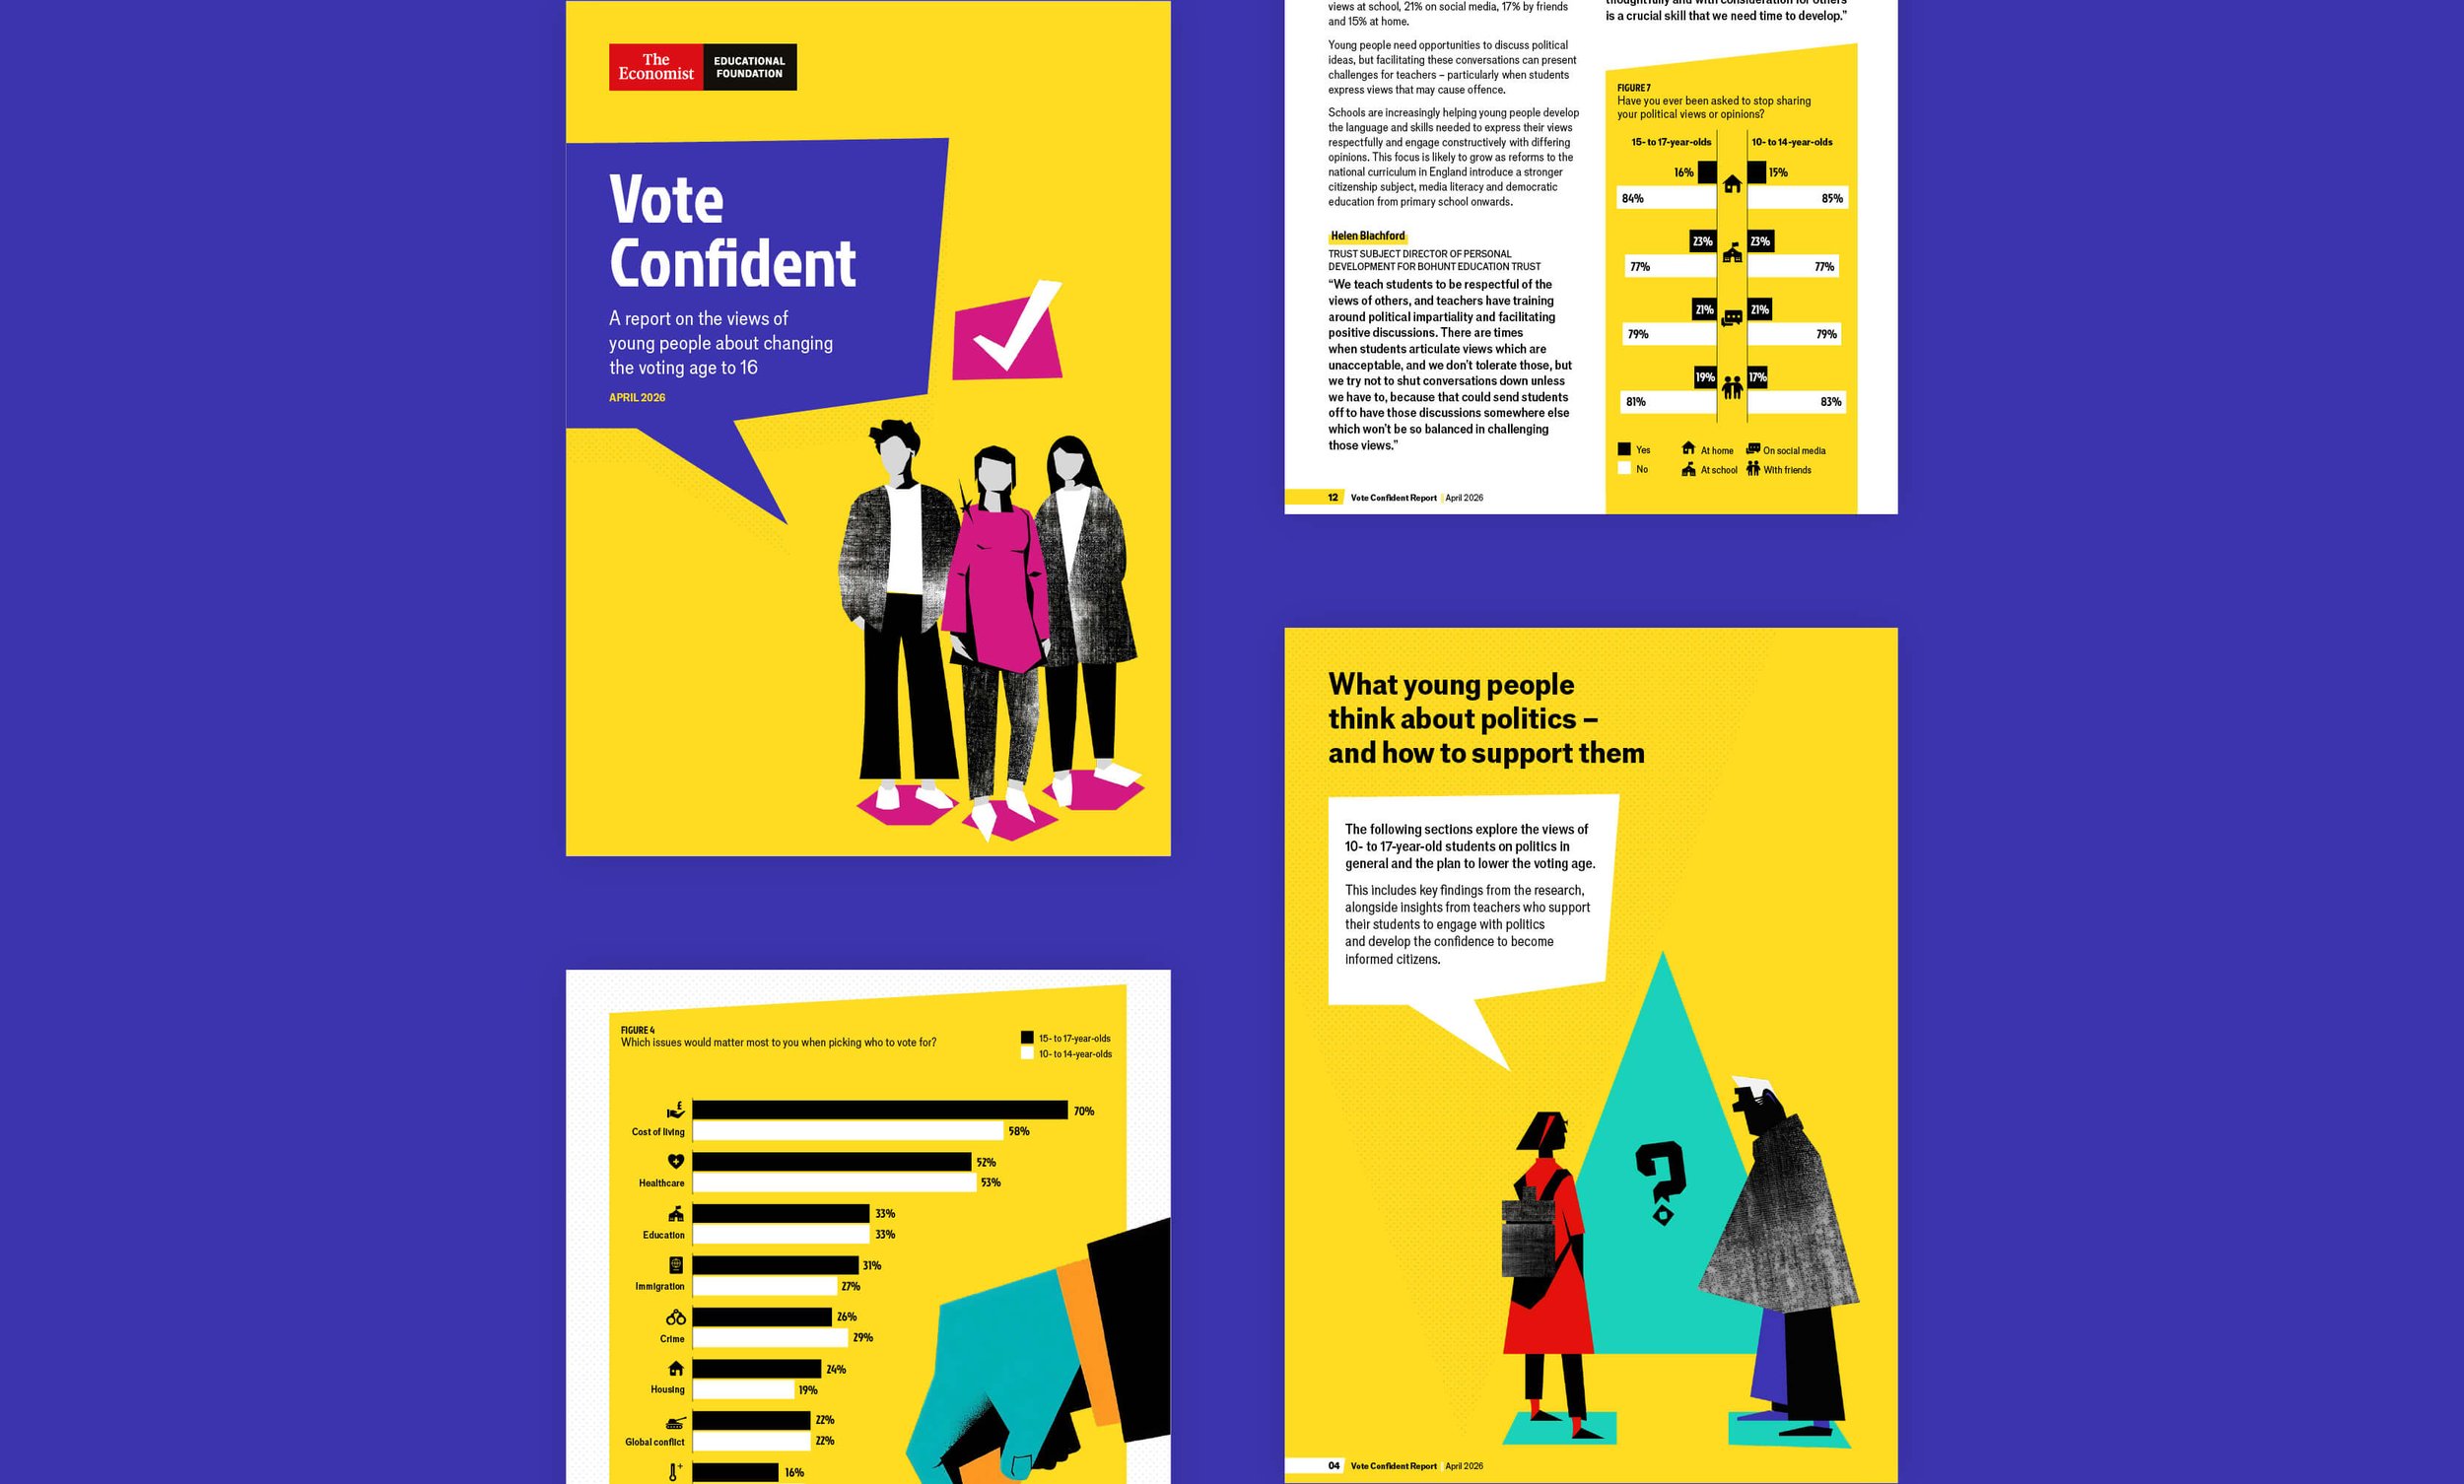
Project
Vote Confident report
Year
2026
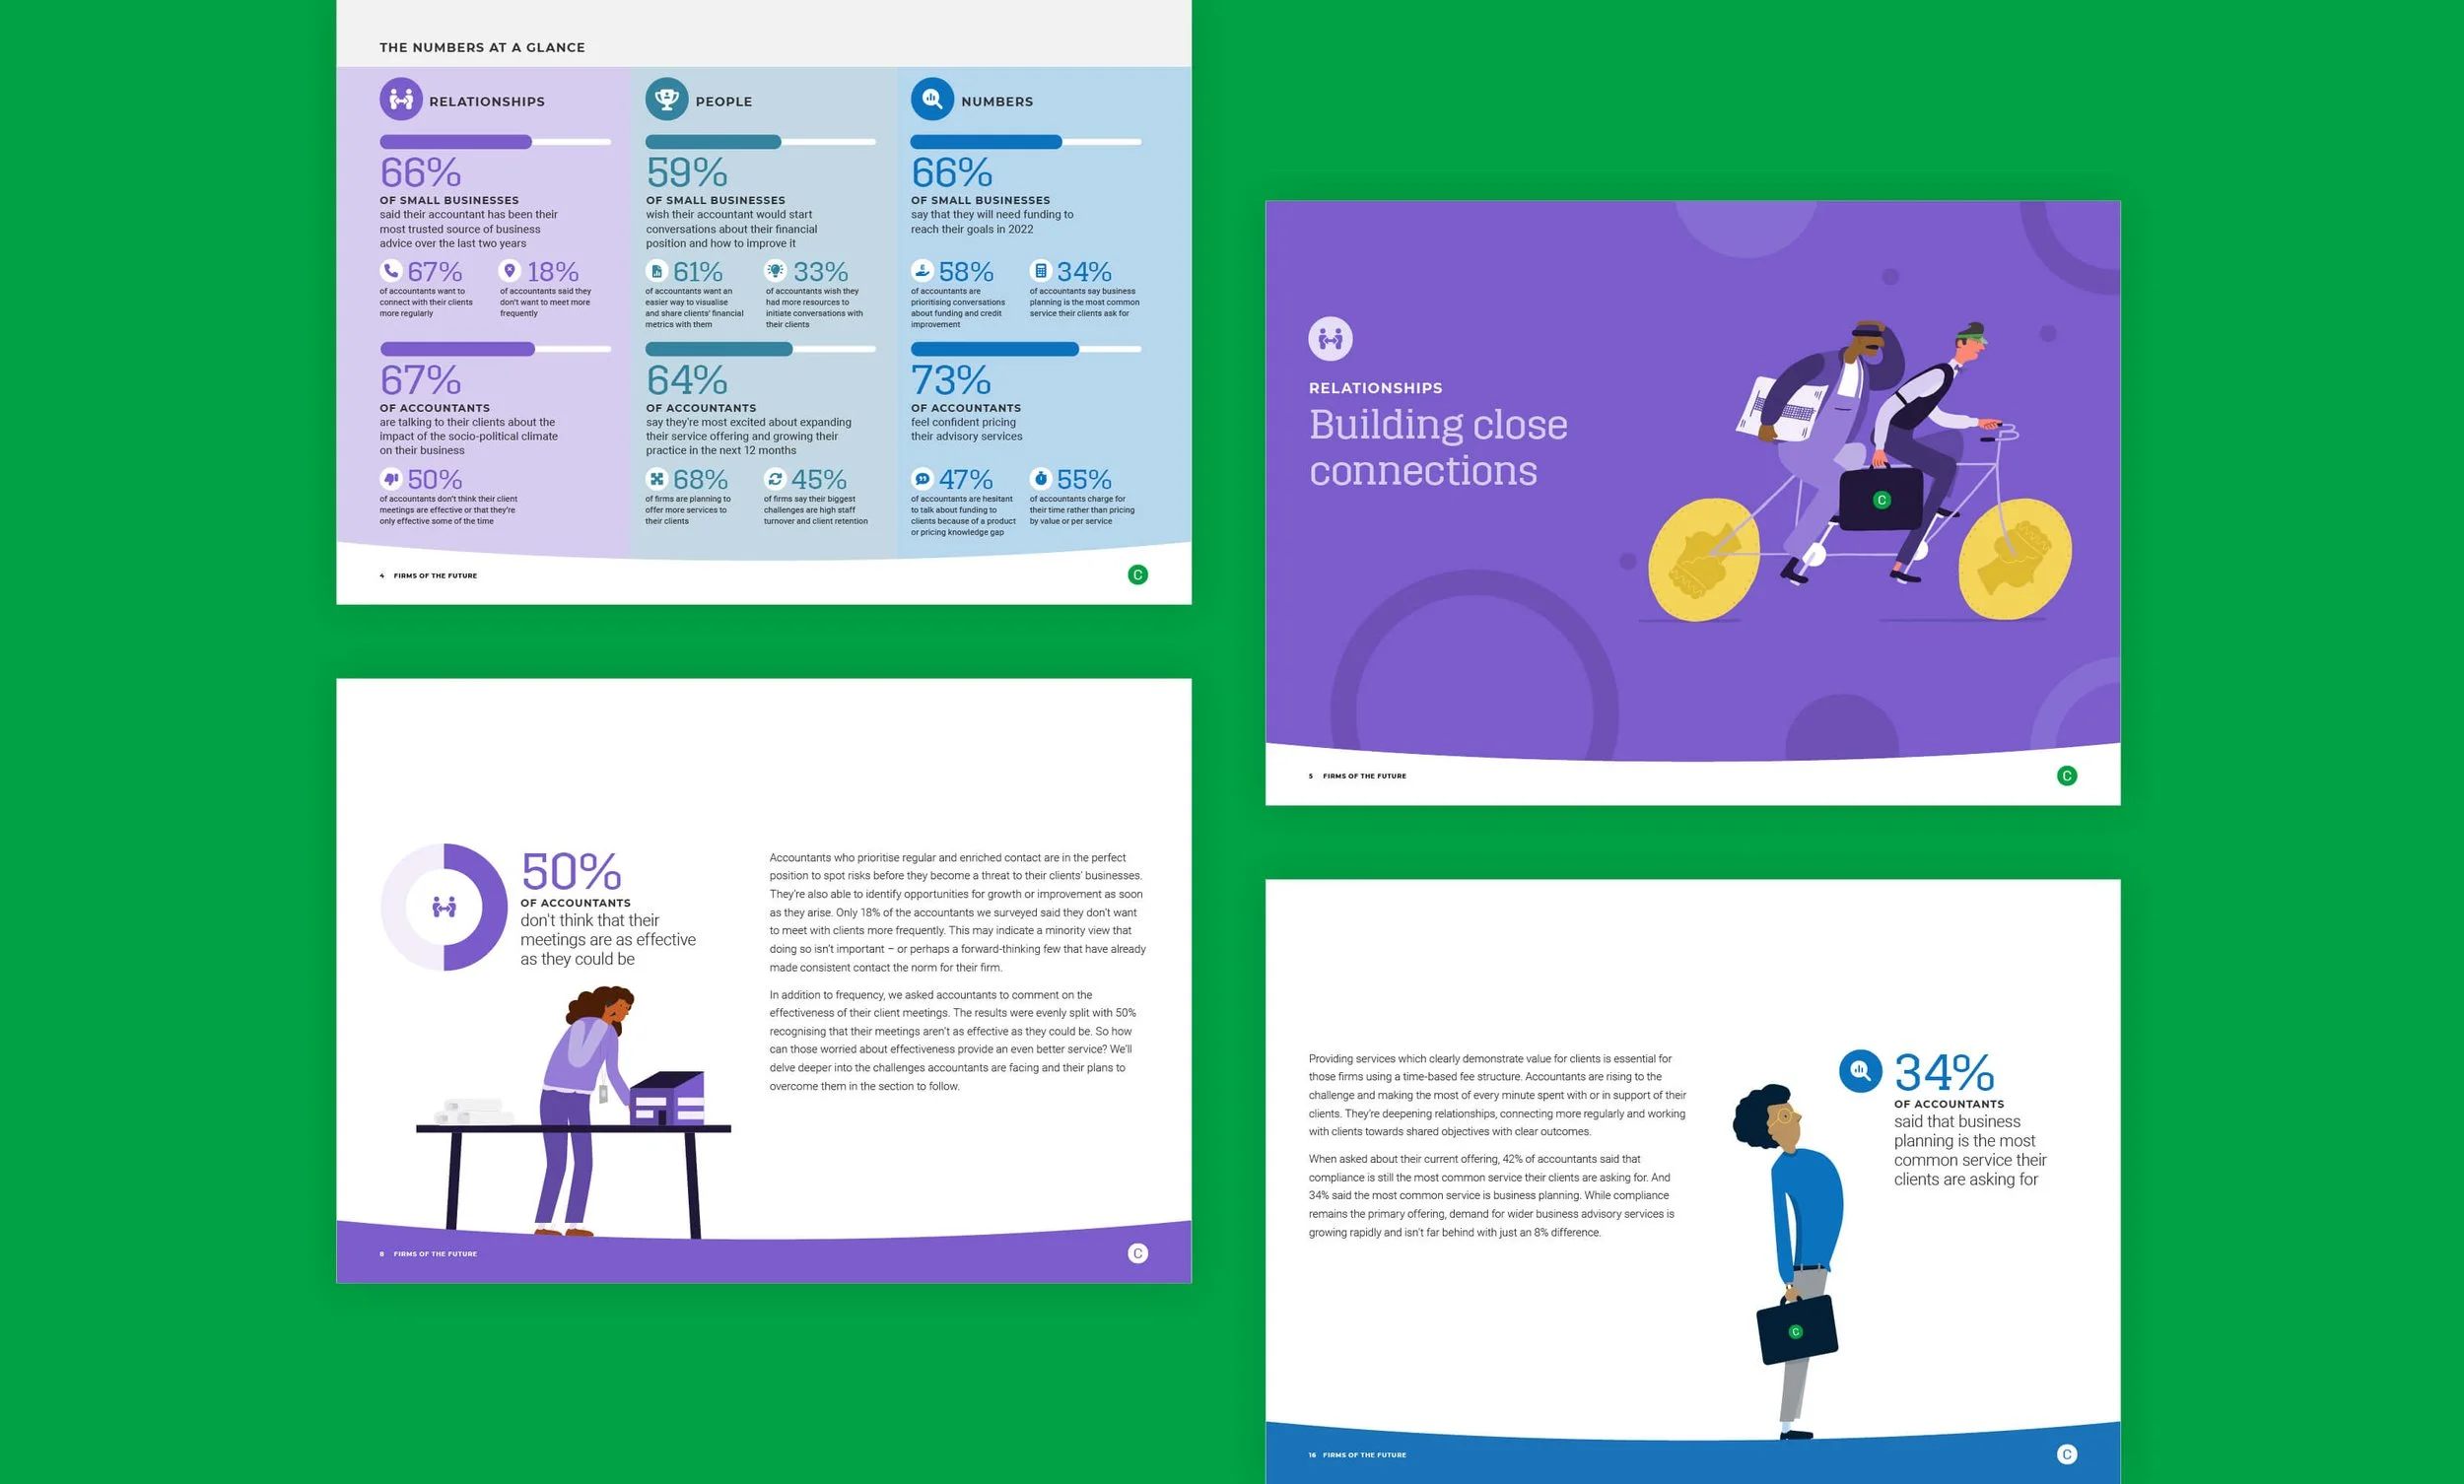
Project
Firms of the Future report
Year
2022
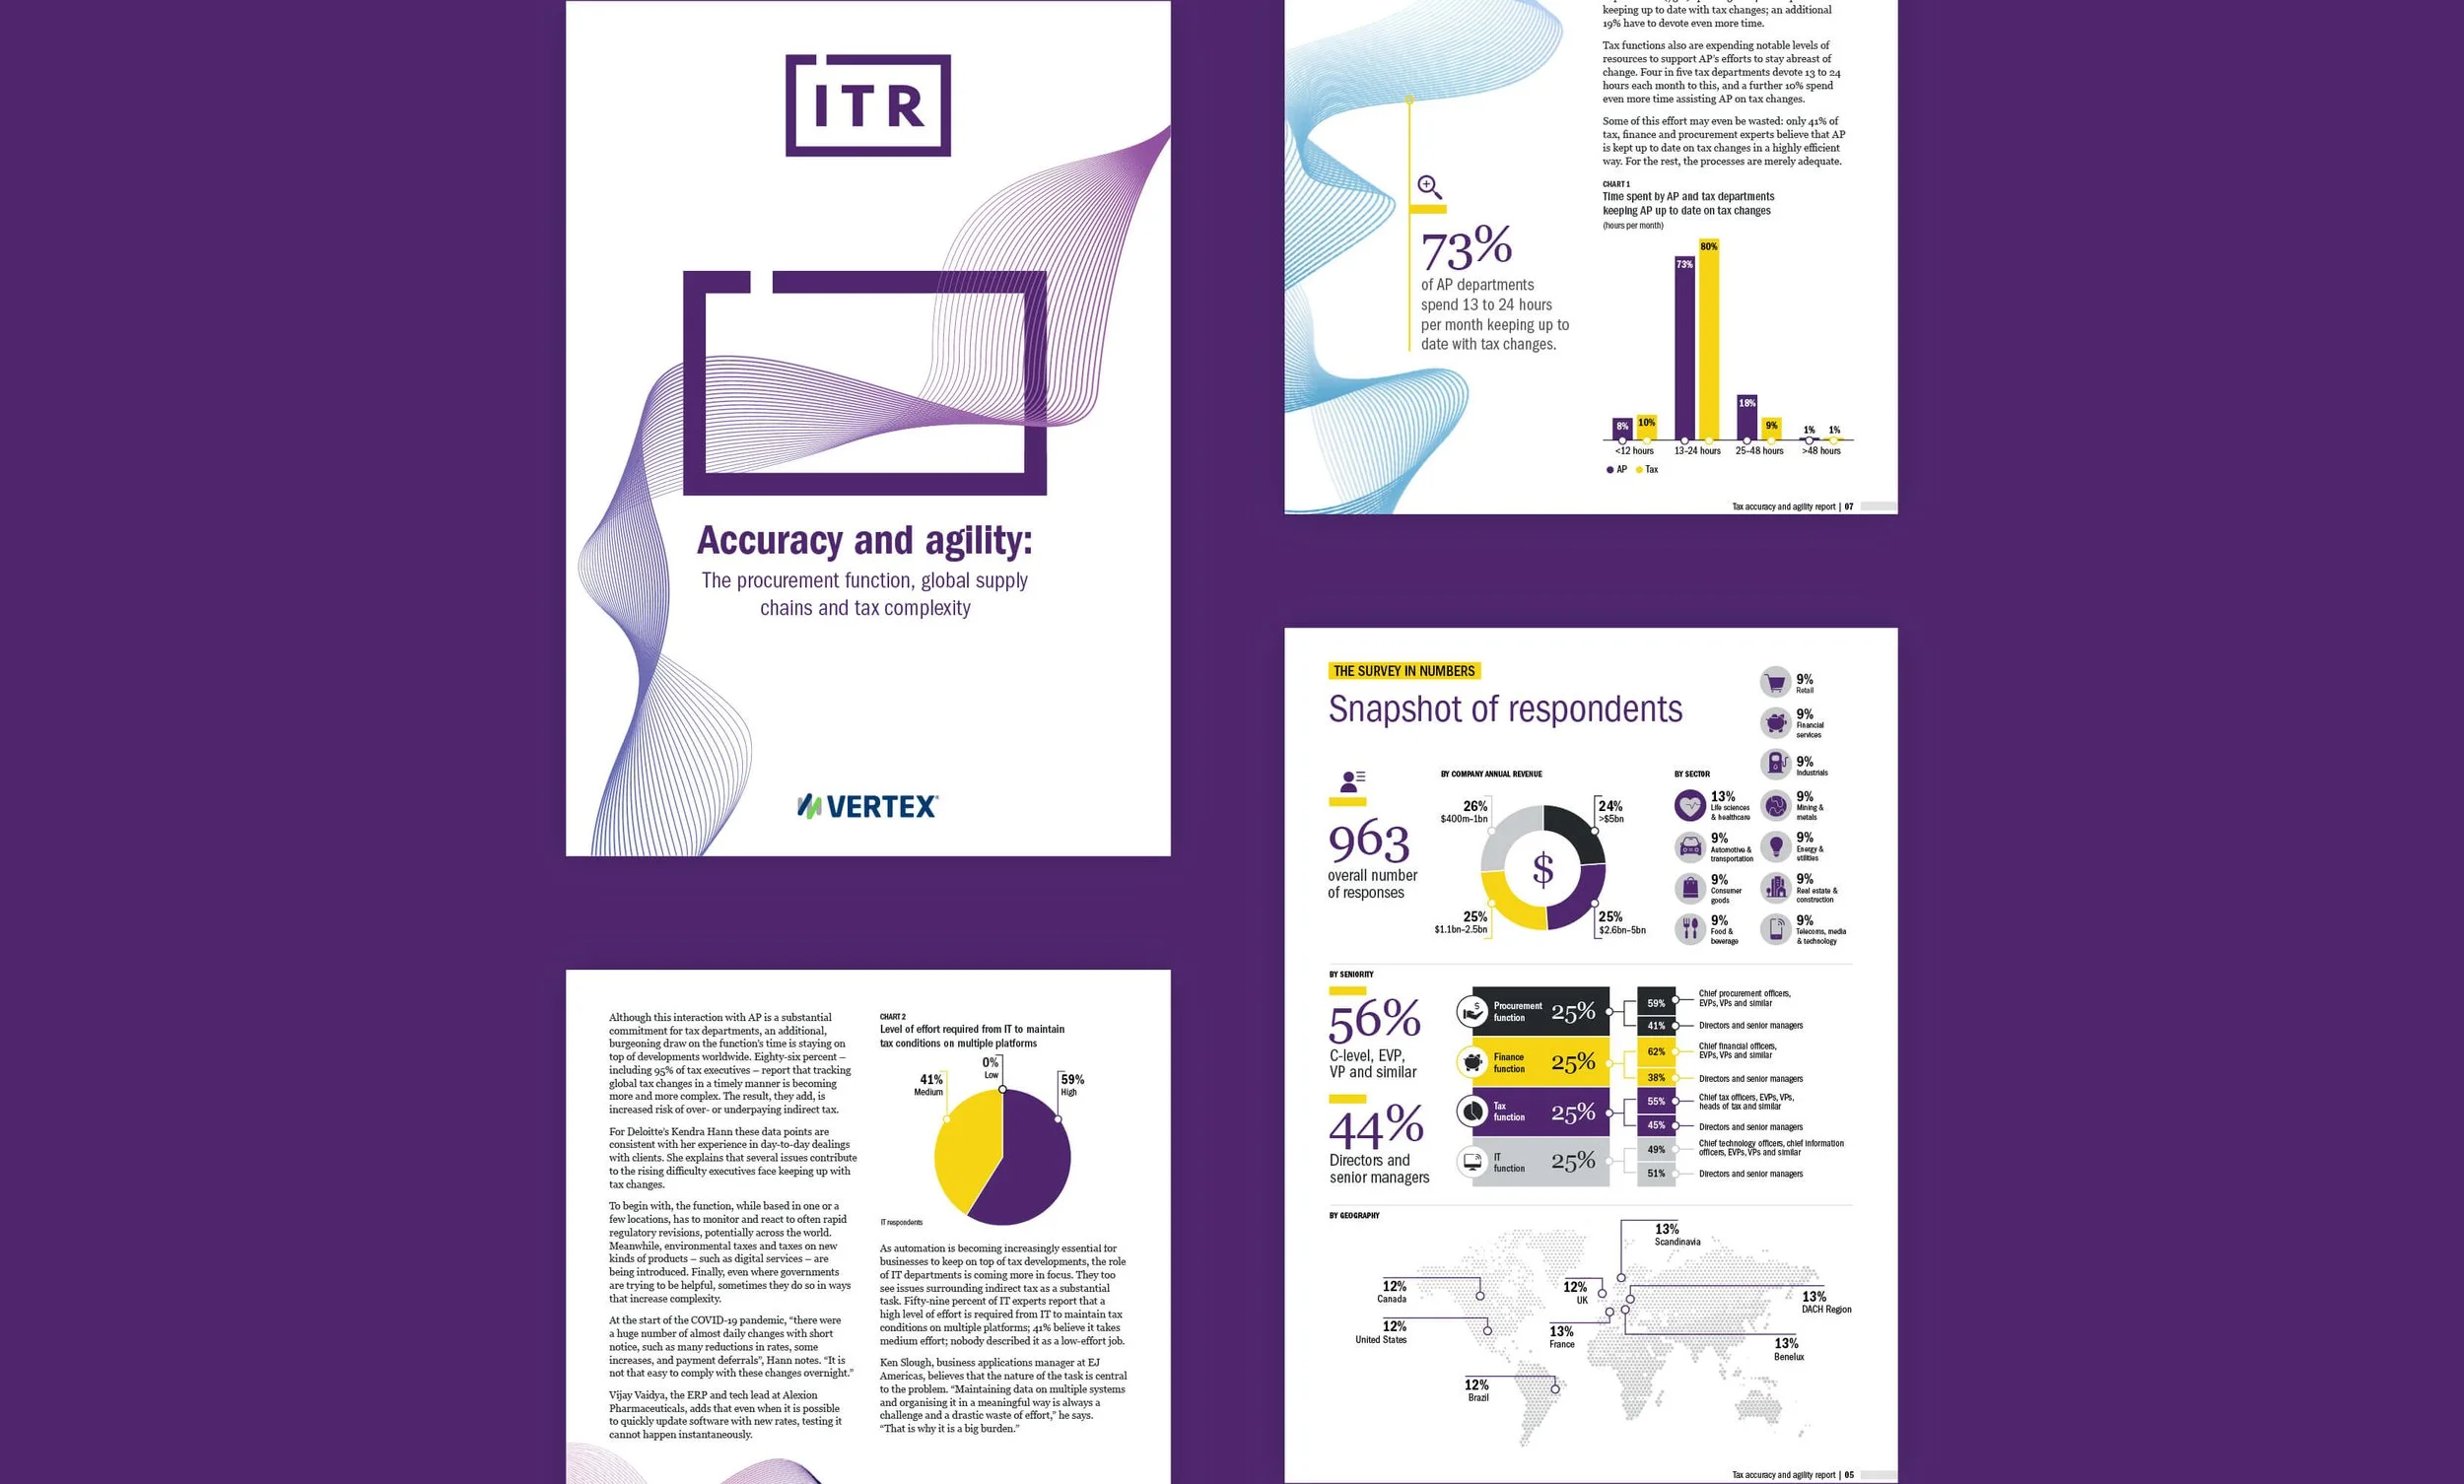
Project
Tax and Procurement report
Year
2021
Project
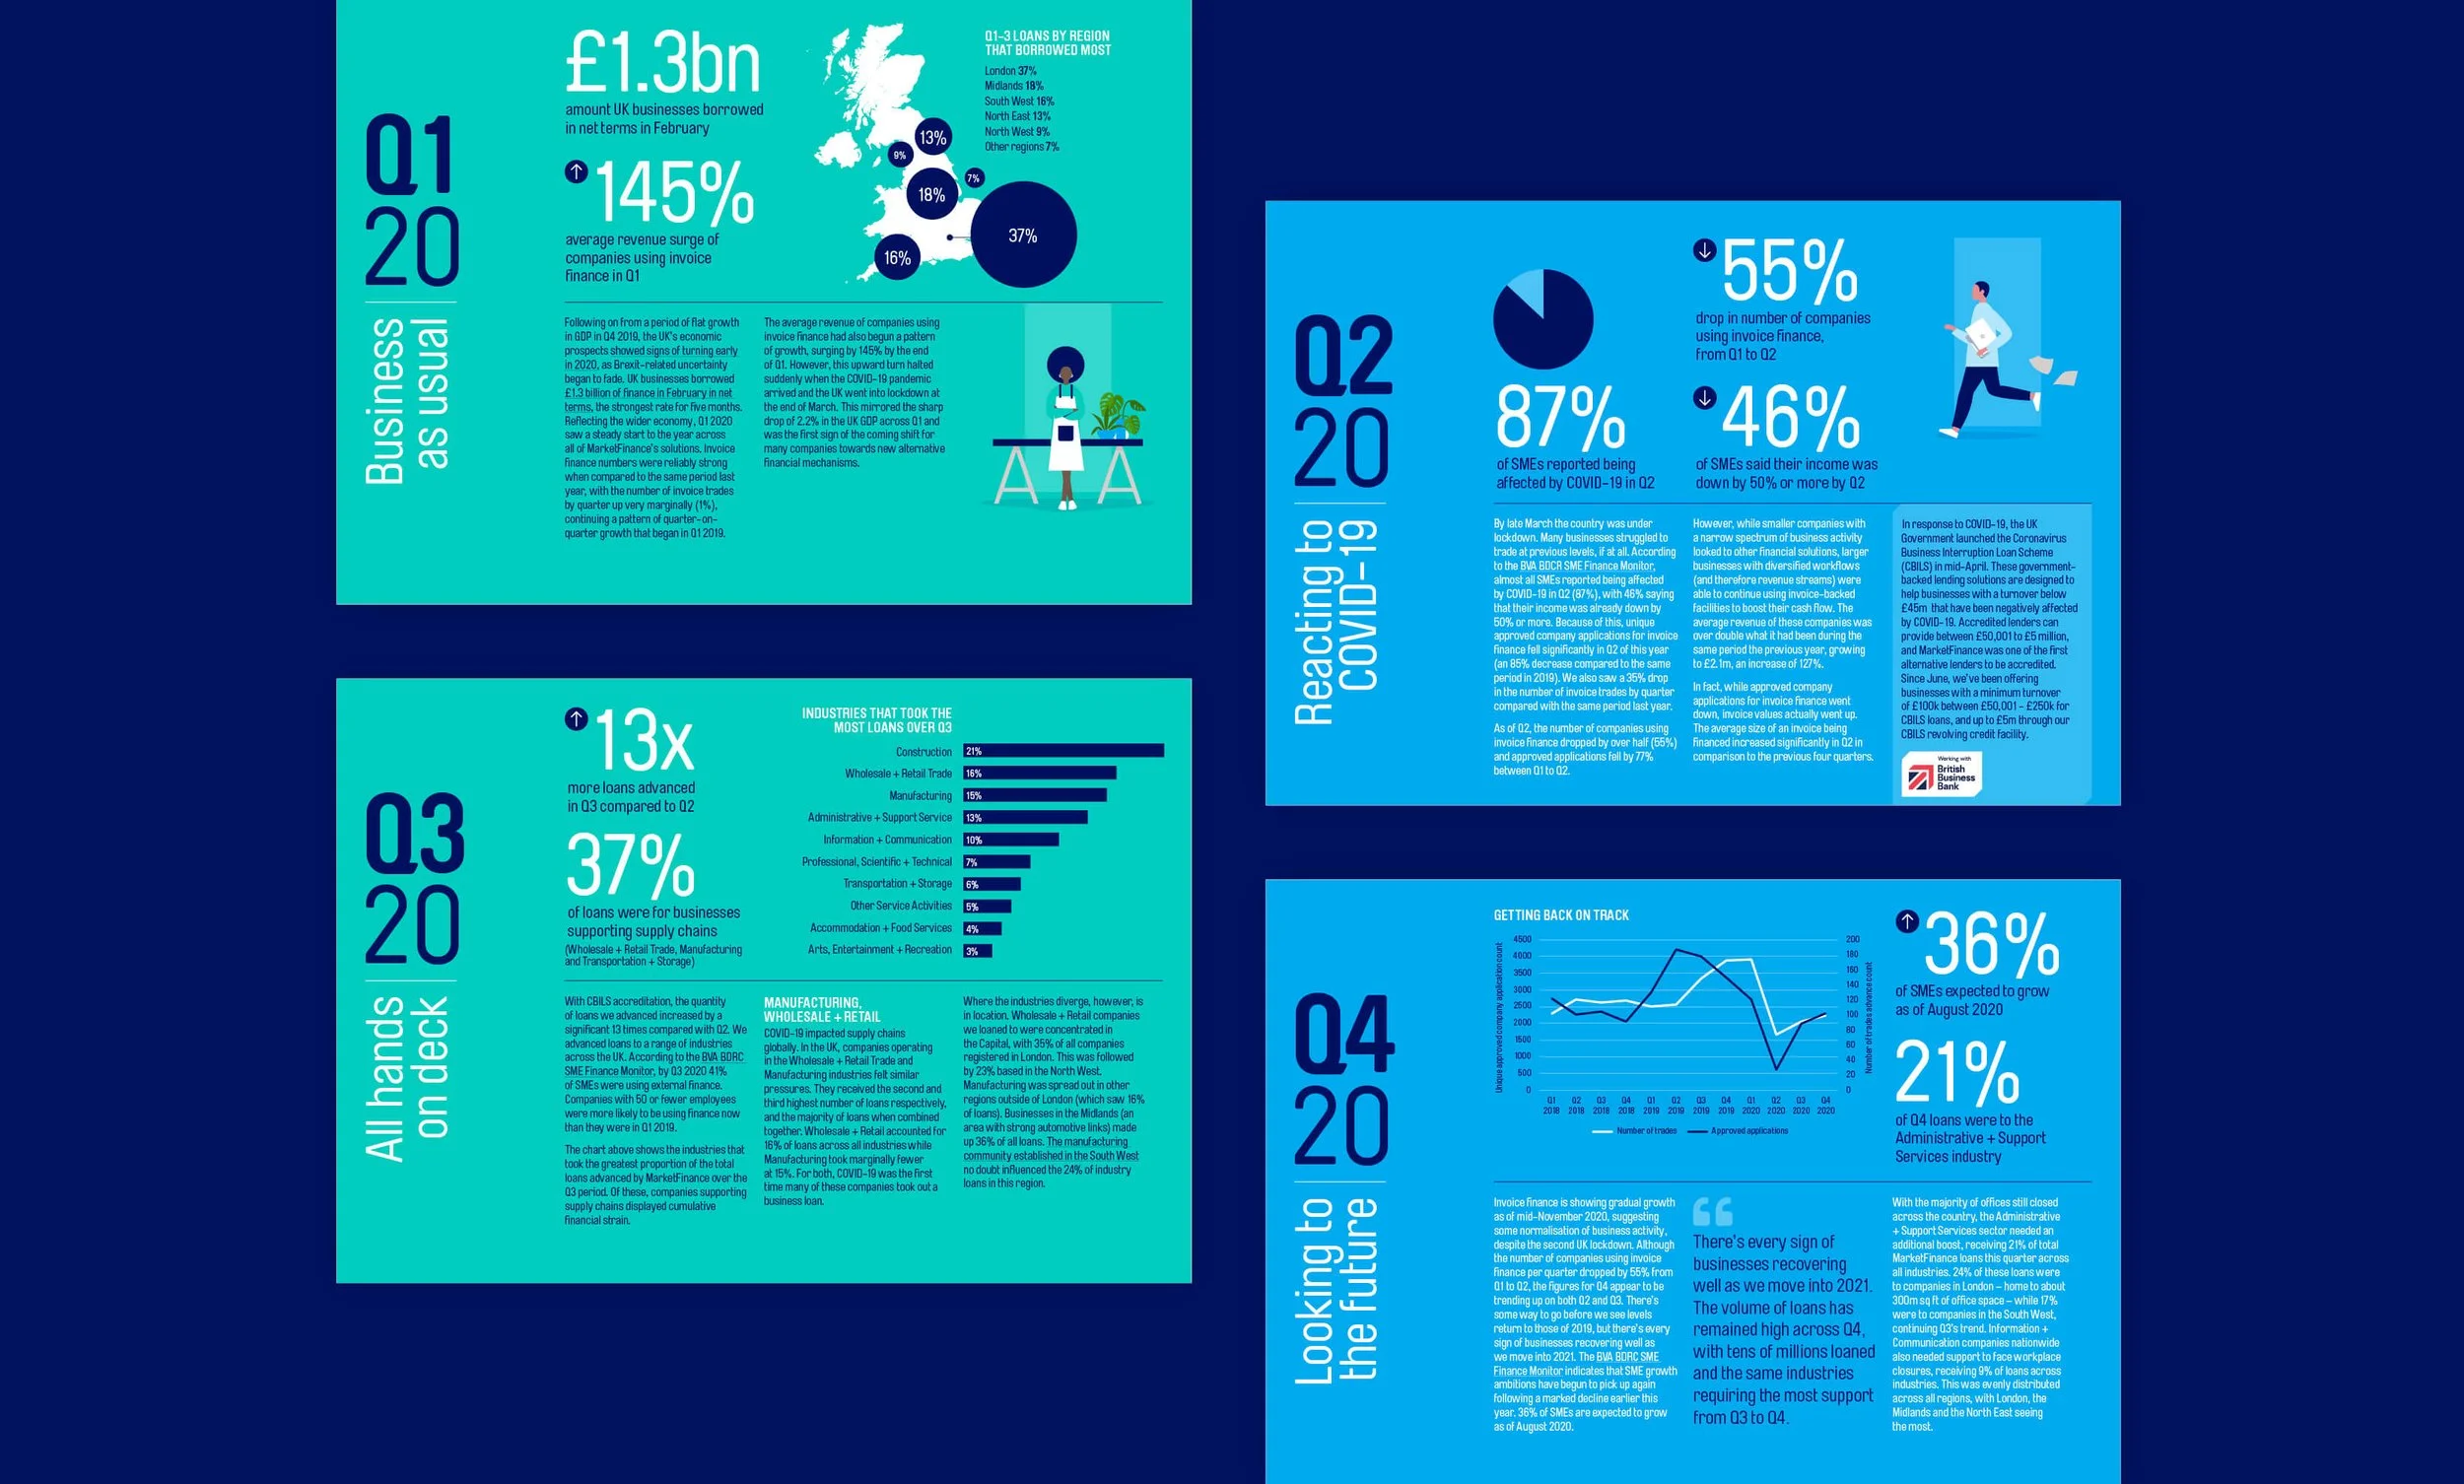
Covid Business Insights report
Year
2021
Client
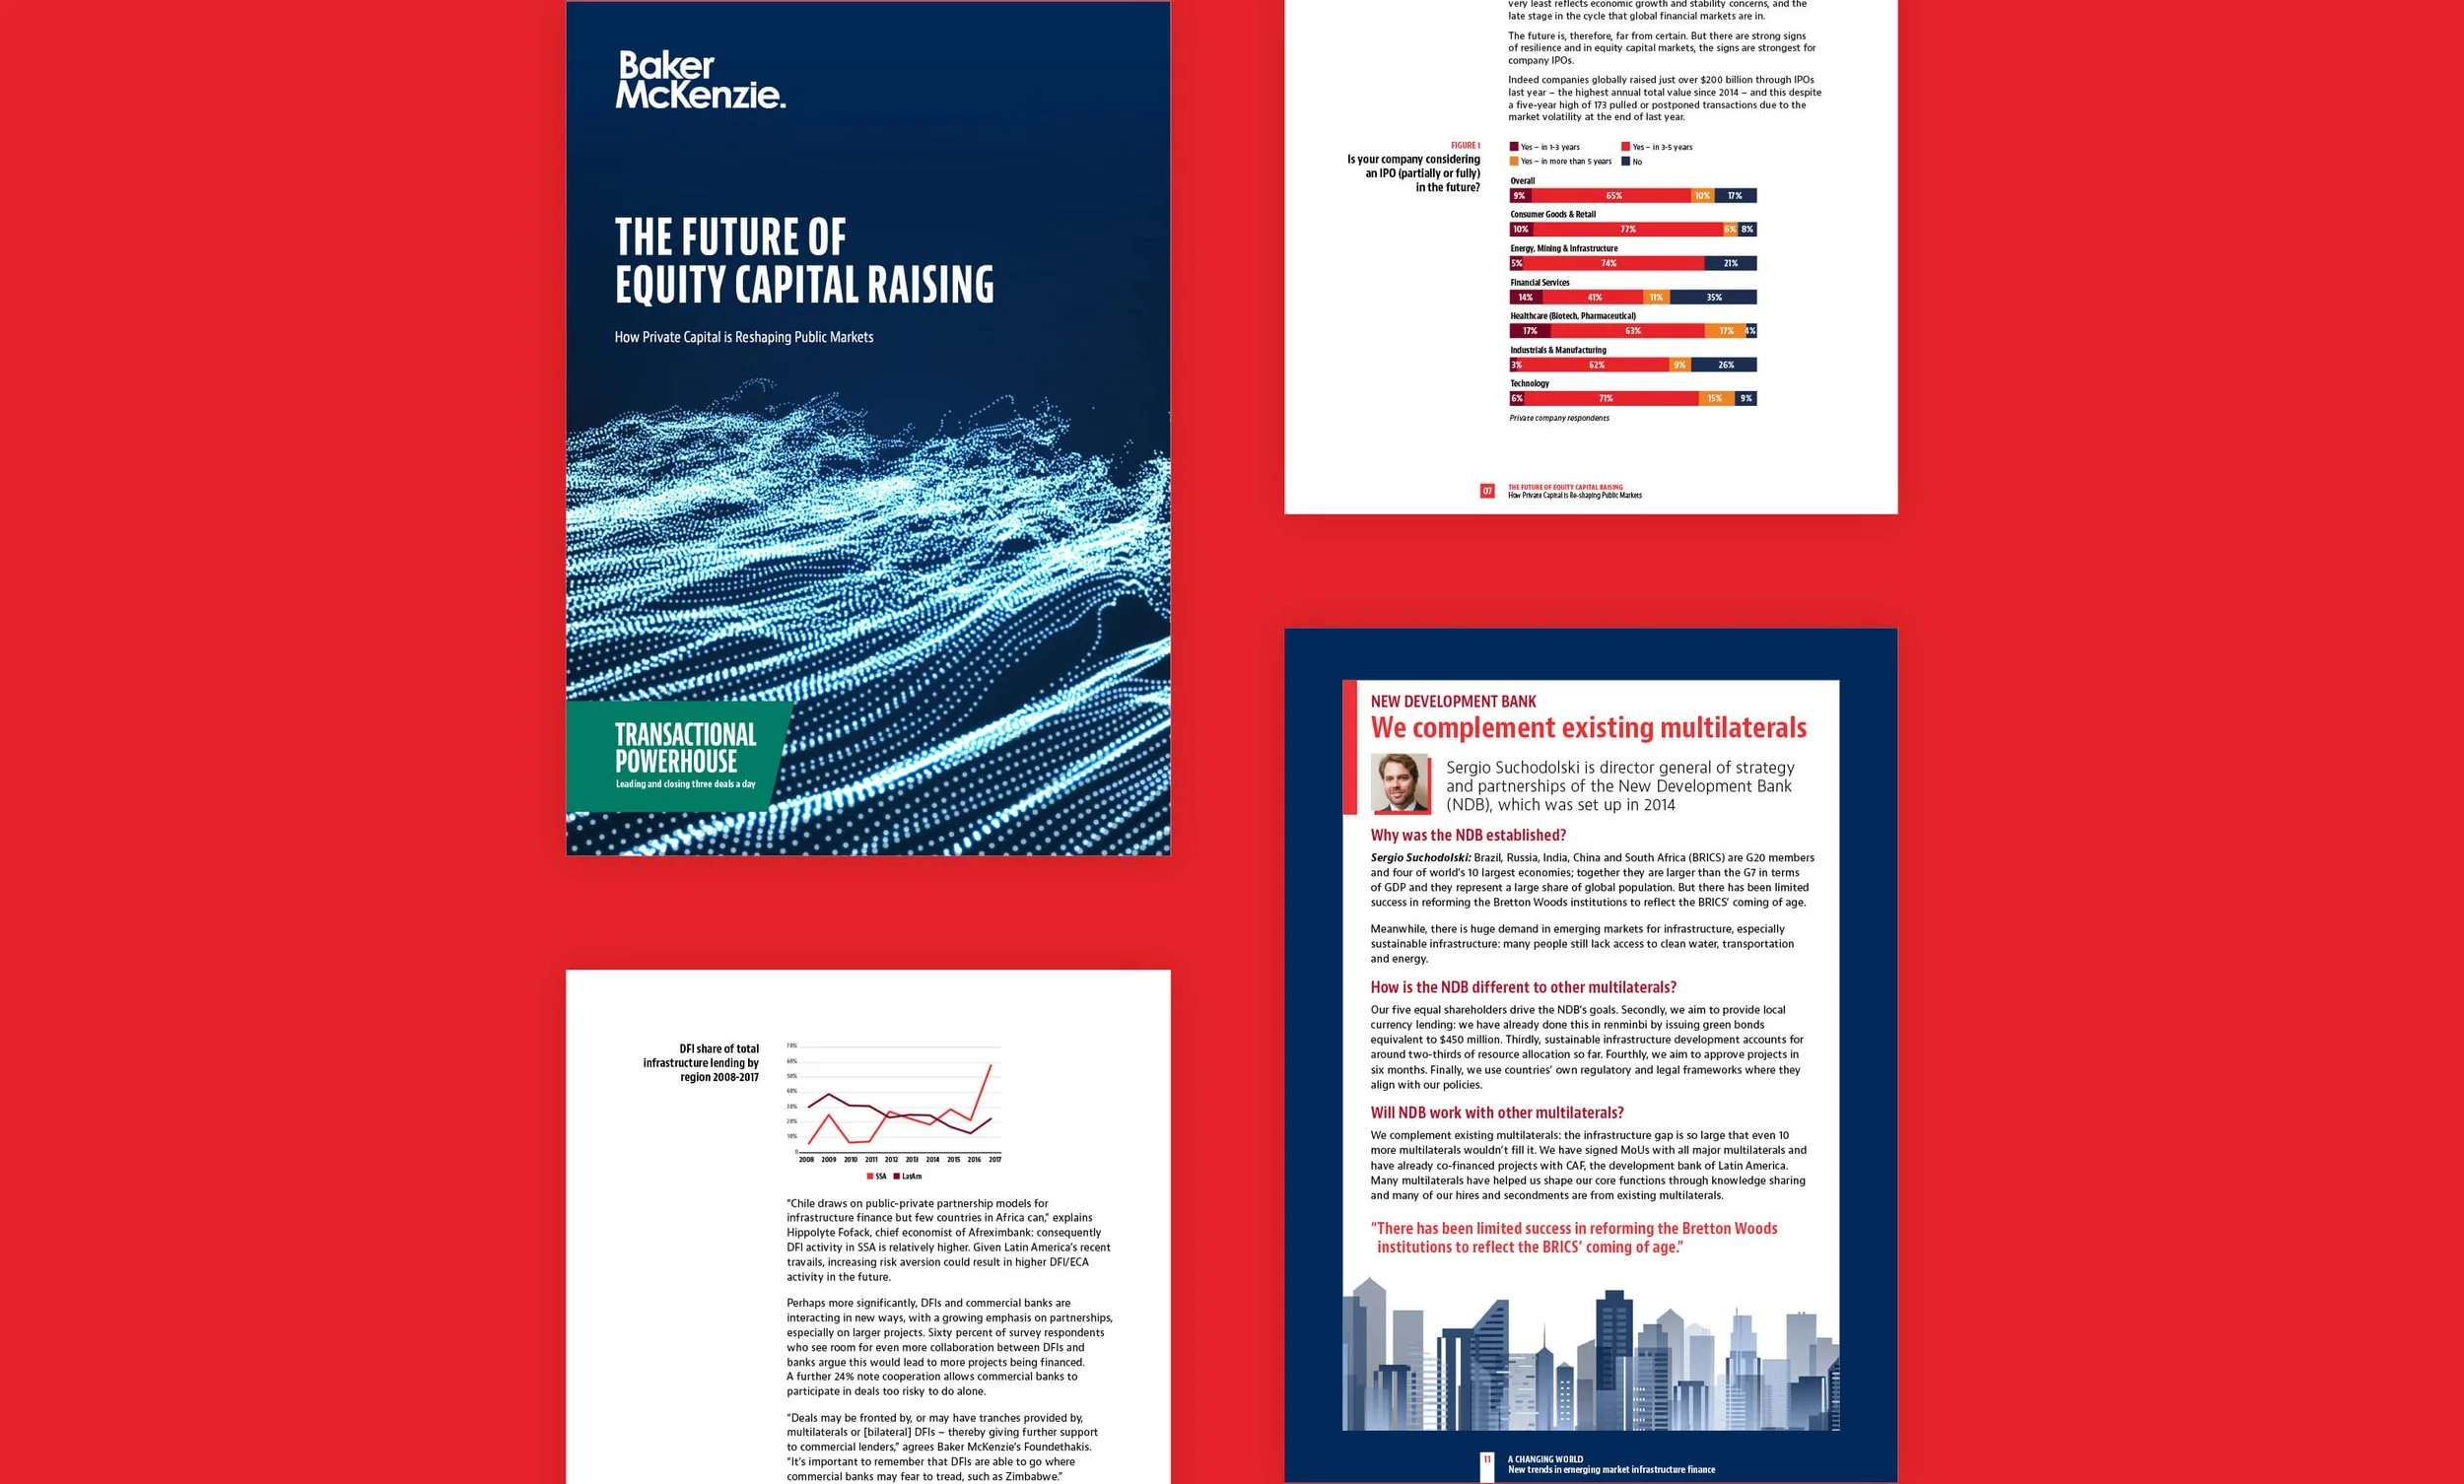
Thought Leadership reports for Baker McKenzie
Year
2019
Client
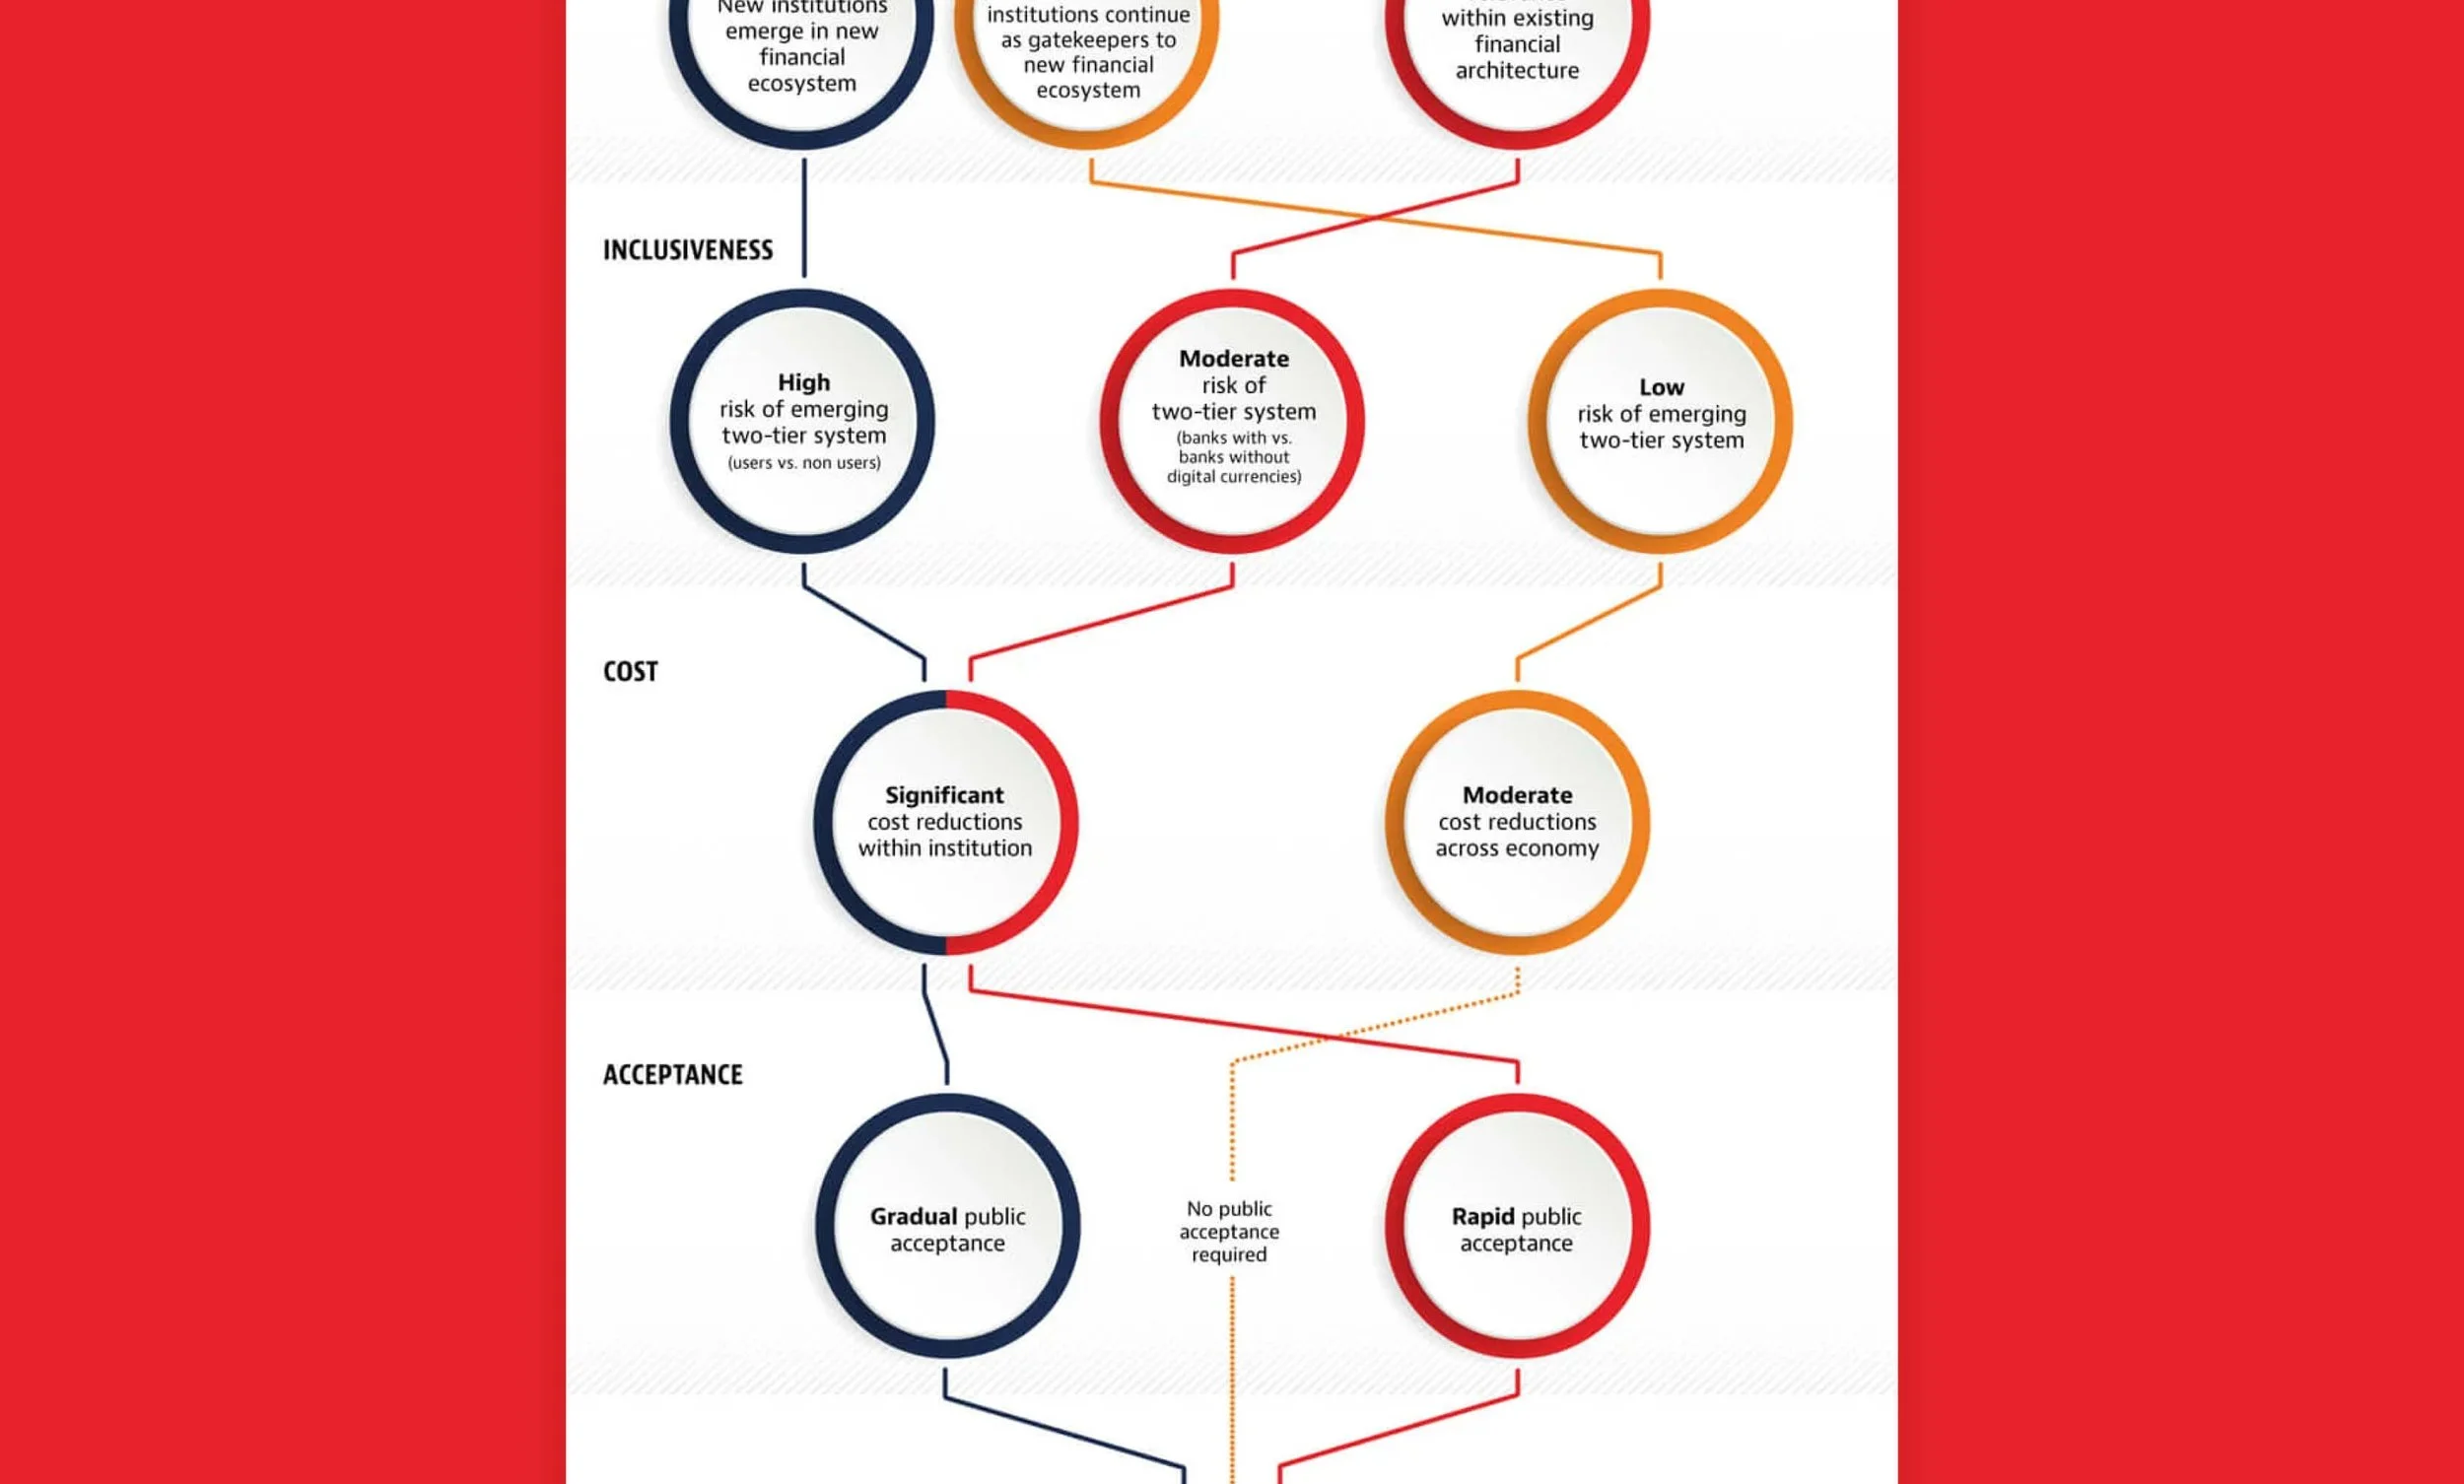
Digital Currencies infographic
Year
2017