
INFOGRAPHICS
Infographics
A selection of static infographics created for various clients. Check out my interactive infographics in the thought leadership section.

Capitalise ‘Get Fit For Business’ report
PDF report // 2022
This Capitalise report tracked just how fit UK businesses were feeling as they headed into 2022. Broken down into three categories: healthy people, healthy relationships and healthy numbers, the report took a look at how small business leaders were feeling amidst the post-covid climate and offered actionable insights into how businesses can get fitness levels back on track in the new year.


Euromoney Thought Leadership Consulting + International Tax Review
PDF report // 2021
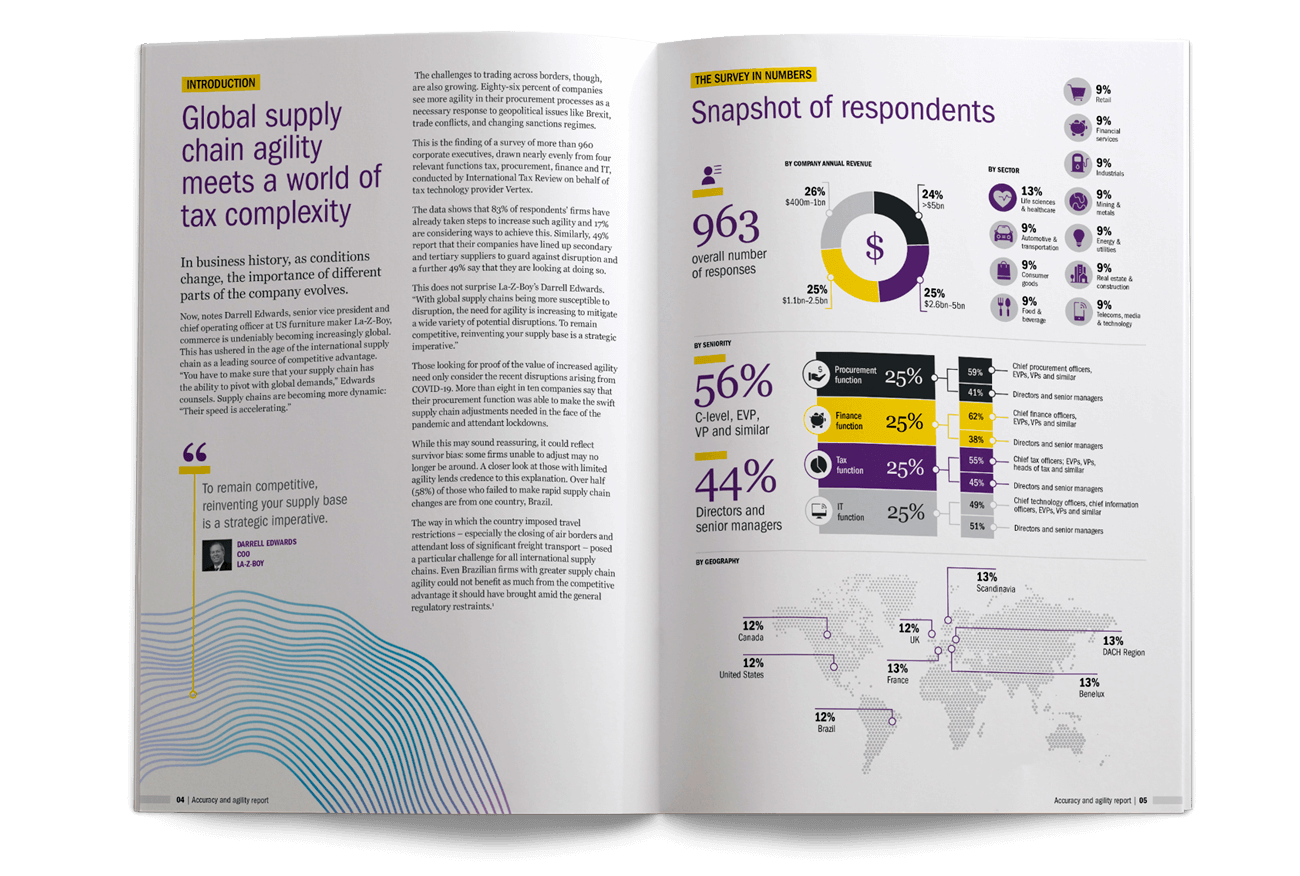
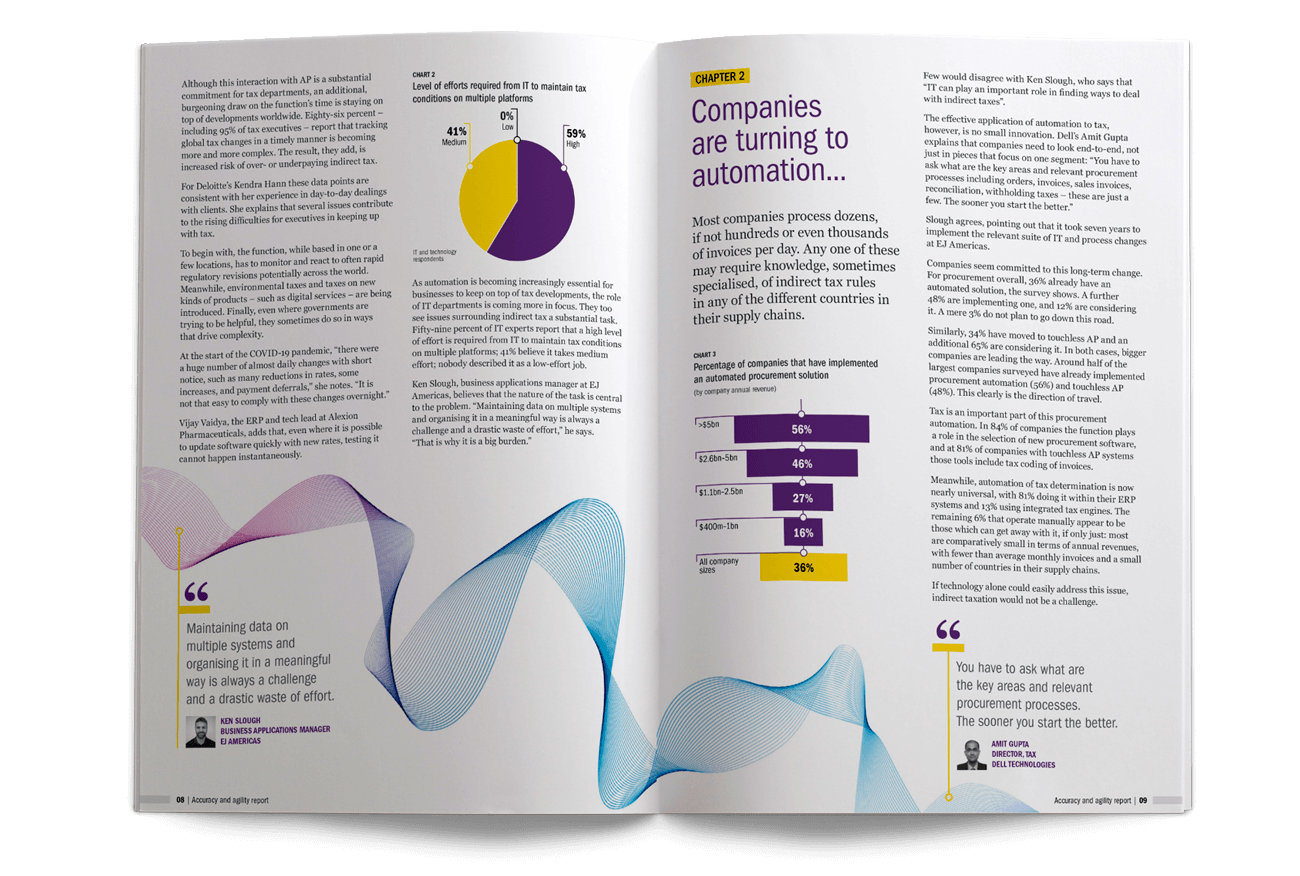
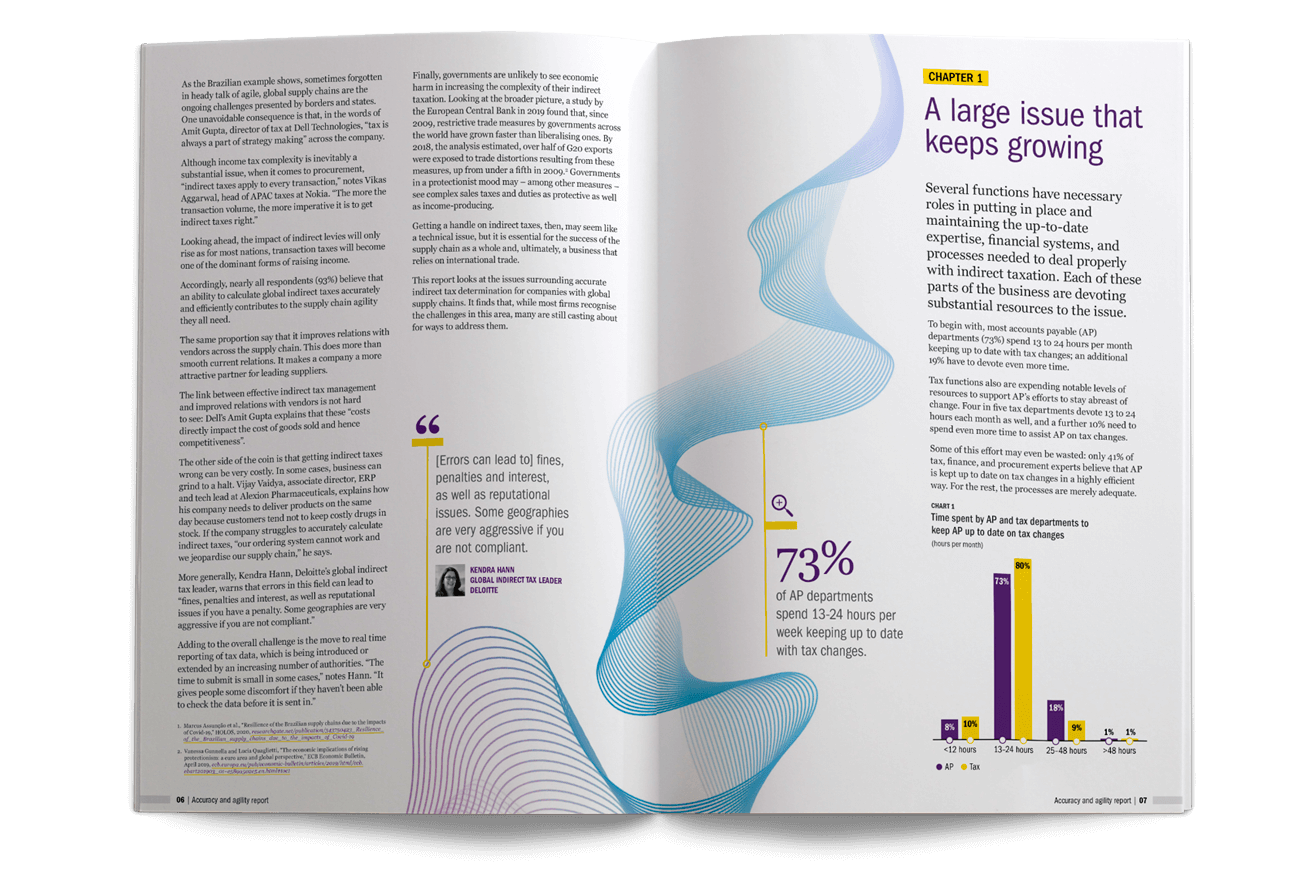
Amid the growing disruptions to global trade – from trade conflicts and Brexit to pandemic-related restrictions – supply chain agility has become, a strategic imperative. This report, commissioned by International Tax Review, looked at this subject through a tax lens. The report design featured charts, pull quotes, a page of infographics, with ripples of uncertainty running throughout.
Nucleus Commercial Finance
Long scroll infographic // 2017
Nucleus, a commercial finance company, needed an infographic to help explain one of their products. A business cash advance works by allowing small businesses that sell goods via credit cards and debit cards to get a loan. They then repay that loan as a percentage of their daily credit card takings. This means that whether the business has a good day or a bad day, they only repay what they can afford. Nucleus wanted the infographic to be character-led, and to have the ability to translate well into a video animation.

Baker McKenzie + Euromoney Thought Leadership Consulting
Long scroll infographic // 2017
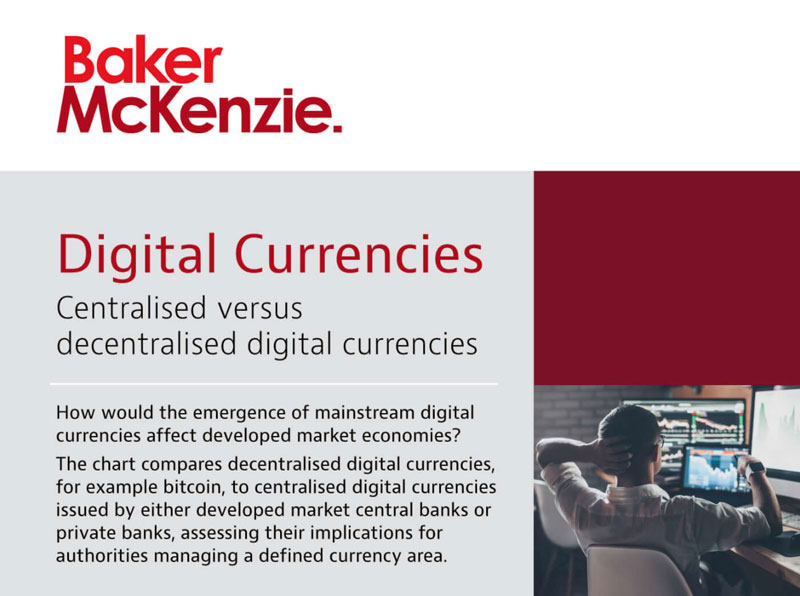
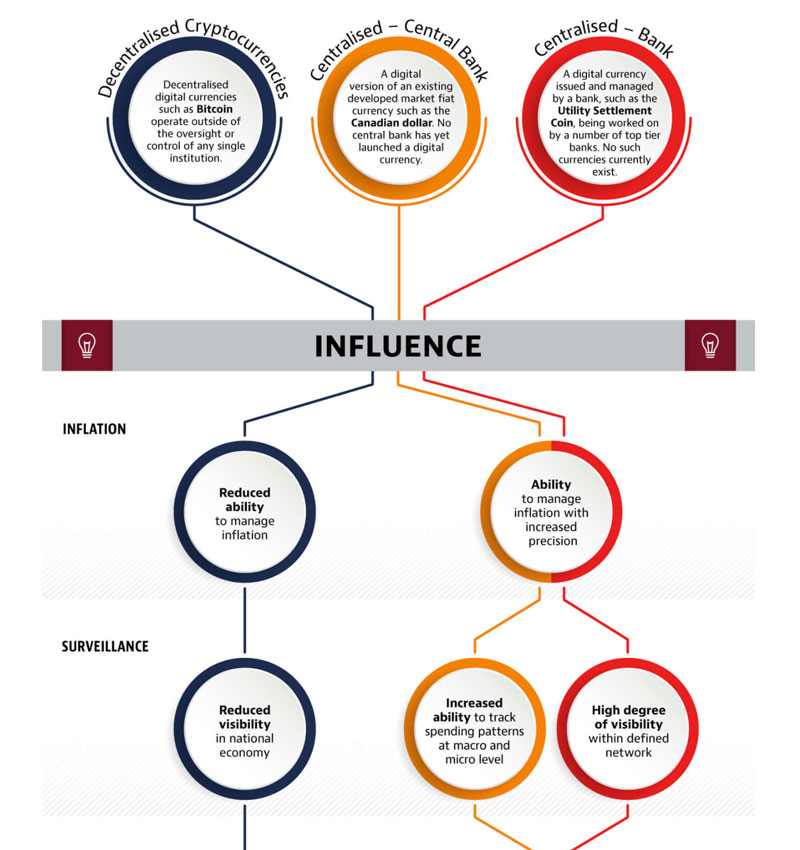
The multinational law firm Baker McKenzie were launching a digital currencies hub. They wanted an infographic that would help to explain the differences between decentralised cryptocurrencies, centralised cryptocurrencies issued by a central bank and centralised cryptocurrencies issued by a bank. Click here to see the full scrolling infographic and read more about the story behind the piece.
Unquoted
Long scroll infographic, broken into sections for social sharing // 2015
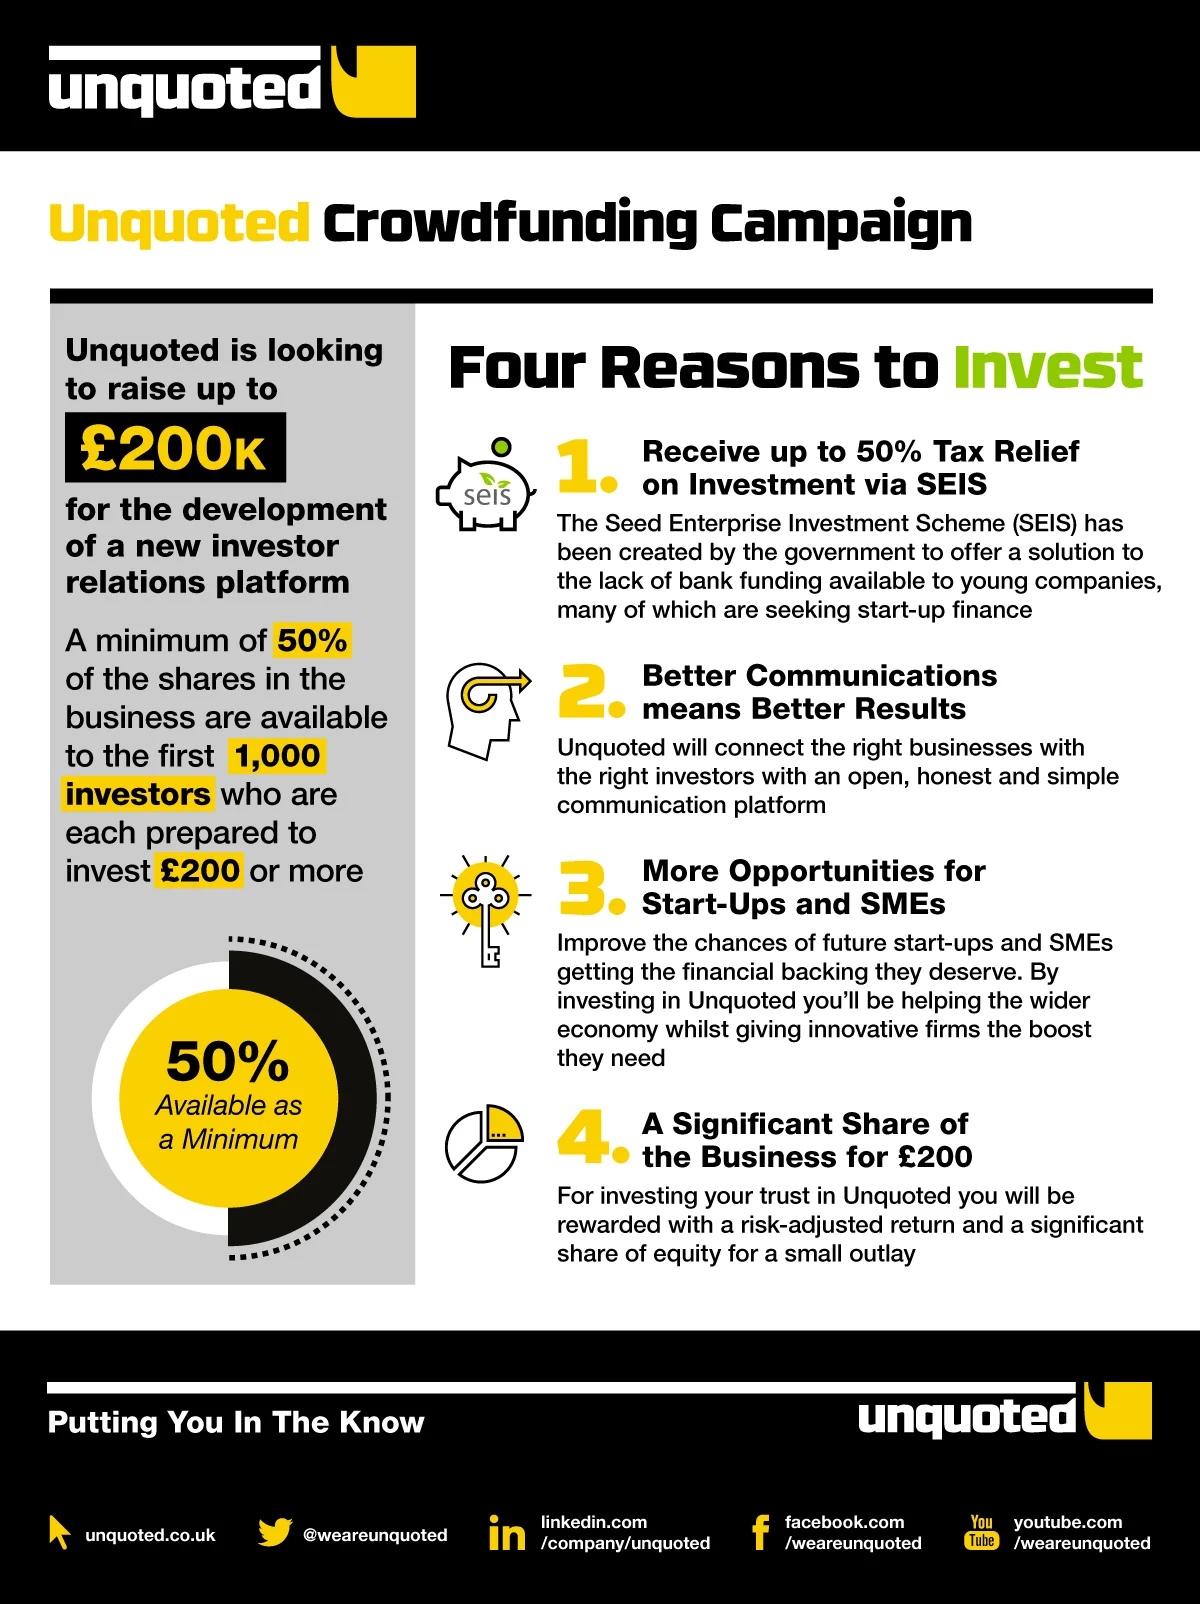
Unquoted was due to launch a crowdfunding campaign to raise money to build a new Investor Relations platform. They wanted an infographic that provided an overview for potential investors and got them excited about the investment opportunity.


MarketInvoice
A4 DPS to sit within a finance guide // 2014
MarketInvoice (now Kriya) produced a guide to the current alternative finance market. This sector is a relatively new development on the financial landscape, and their guide aims to help people understand the various options. The infographic provides an overview of the alternative finance market.

A4 DPS to sit within an e-book // 2014
MarketInvoice produced an e-book called What To Do If The Bank Says No. The e-book gave advice on alternative finance options for SMEs at different growth stages.

Economist Intelligence Unit + EY
EY and the Economist Intelligence Unit looked at CFOs of large companies in 2002 and found out what they were doing ten years later. The results were analysed and compiled into a white paper, and an infographic of the results was produced to sit within the report.
A4 DPS to sit within a report // 2012


